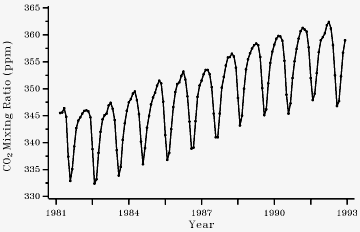
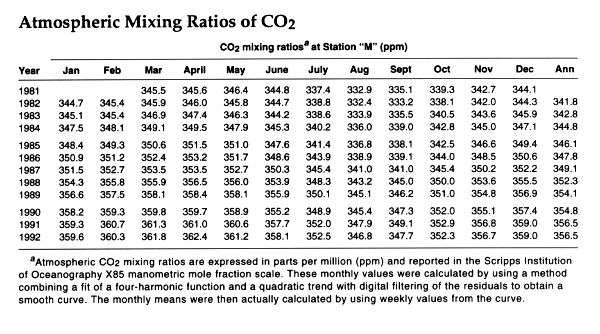
The Ocean Station "M" sampling site, in the North Atlantic, is operated in cooperation with the Norway Meteorological Institute. The NOAA/CMDL flask data from Ocean Station "M" show an increase in the annual value from 341.8 parts per million (ppm) in 1982 to 356.5 ppm in 1992, or 1.47 ppm per year. Conway et al. (1994) reported a global growth rate of 1.43 ppm per year during 1981-92 for all NOAA/CMDL flask sampling sites. Conway et al. (1993) found the CO2 and CH4 flask data from Station "M" were highly correlated during winter, and suggested the CO2 variations observed in the Arctic atmosphere during winter are due primarily to variations in emissions and transport of CO2 from Europe and Asia. Atmospheric CO2 concentrations at Ocean Station "M" show a seasonal pattern, with the annual minimum occurring in August or September and the annual maximum occurring in March or April. Conway et al. (1994) reported that the peak-to-trough seasonal amplitude for Ocean Station "M" was 15.0 ppm for 1981-92.
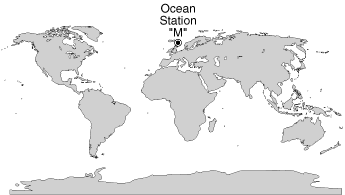
Station "M", North Atlantic Ocean
Open ocean
66°00' N, 2°00' E
6 m above MSL
![]() Station
"M" Graph - Monthly atmospheric CO2 mixing
ratios at Station "M."
Station
"M" Graph - Monthly atmospheric CO2 mixing
ratios at Station "M."
![]() Station
"M" Table - CO2 mixing ratios at Station "M"
(ppm)
Station
"M" Table - CO2 mixing ratios at Station "M"
(ppm)
Original page originally located at http://cdiac.esd.ornl.gov/trends_html/trends/co2/noa2/stam-tre.htm
Date revised 4/10/95 (gg)